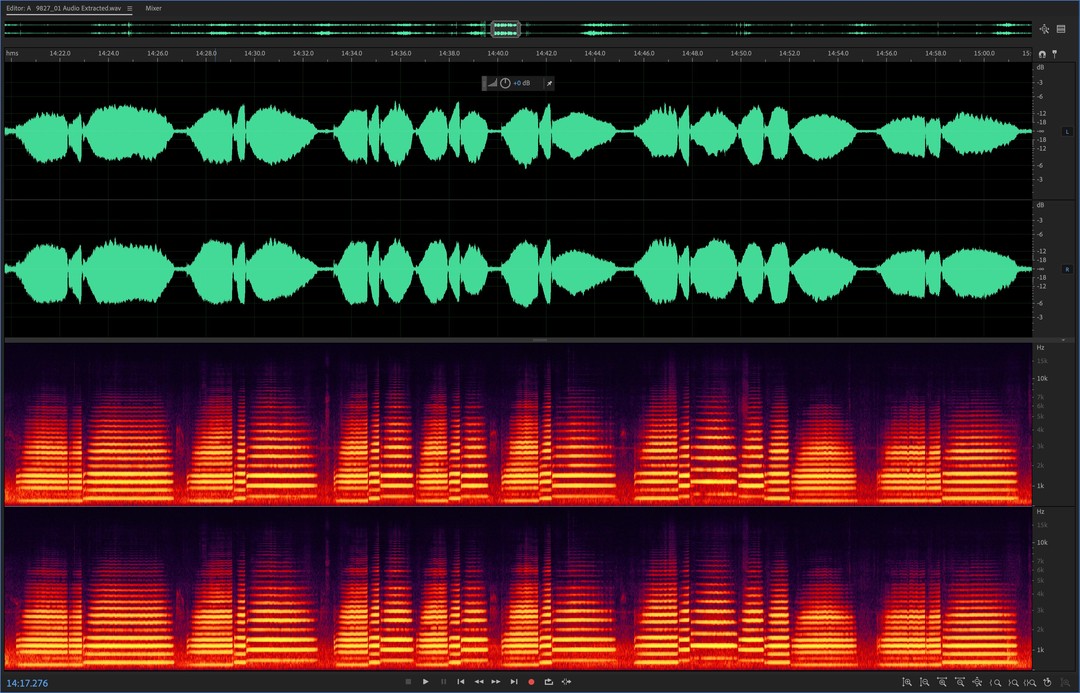
[igp-video src=”” poster=”https://www.arlington.media/wp-content/uploads/2018/11/this-is-an-audio-waveform-and-spectral-frequency-view-of-a-@usmc-playing-taps-at-arlington.-the-gree.jpg” size=”large”]
and Respectful Photography and Video
for Families Attending Services
at
Arlington National Cemetery
Ready to Book, or Need Additional Information?
Call toll-free: (800) 852-7015
We are normally covering services during the day, and tend to return phone calls in the late afternoon / early evening.
Email questions, or request additional information. Please do not provide credit card information via email. You can securely make payments via the link we emailed and SMSed you three days after the service.
Fill Out the form Below


1 DEPENDENT SERVICES
When a spouse or other dependent of a current or former member of the Armed Forces is buried at Arlington, the military service in which the primary party served will provide:
- A chaplain
- A casket team (body bearers / pall bearers)
No other military funeral honors will be rendered unless the spouse also served in the military.
2 STANDARD HONORS SERVICES
Enlisted service members, WO-1 through CW-3, and O-1 through O-3, interred/inurned at Arlington National Cemetery will receive honors provided by the decedent’s branch of service. These honors include:
- A chaplain
- A casket team (body bearers / pall bearers)
- A firing party
- A bugler
3 FULL HONORS SERVICES
In addition to the standard military funeral honors, some Commissioned and Warrant officers and senior non-Commissioned Officer with a pay grade of E-9, CW-4 and CW-5, and O-4 and above:
- ARMY: Sergeant Major (SGM), Command Sergeant Major (CSM), Sergeant Major of the Army (SMA),
- NAVY & COAST GUARD: Master Chief Petty Officer (MCPO), Fleet/Command Master Chief Petty Officer, Master Chief Petty Officer of the Navy (MCPON), or Coast Guard (MCPOCG),
- MARINES: Master Gunnery Sergeant (MGySgt), Sergeant Major (SgtMaj), Sergeant Major of the Marine Corps (SgtMajMC),
- AIR FORCE: Chief Master Sergeant (CMSgt), First Sergeant, Command Chief Master Sergeant, Chief Master Sergeant of the Air Force (CMSAF),
are eligible for full military funeral honors at Arlington National Cemetery including:
- A chaplain
- A casket team (body bearers / pall bearers)
- A firing party
- A bugler
- A military band
- An escort platoon (size varies according to the rank of the deceased)
Additionally, those eligible for full military funeral honors at Arlington National Cemetery may use the caisson (as of January 2025, UNAVAILABLE until Spring 2025), if available. Officers in the rank of colonel and above in the Army and the Marine Corps may be provided a caparisoned (riderless) horse, if available. General/flag officers may receive a cannon salute (17 guns for a four-star general, 15 for a three-star, 13 for a two-star, 11 for a one-star), if available.
